3 Aug 2026
Aligning Football Expected Goals with Tennis Hold Percentages to Form Resilient Daily Multiples
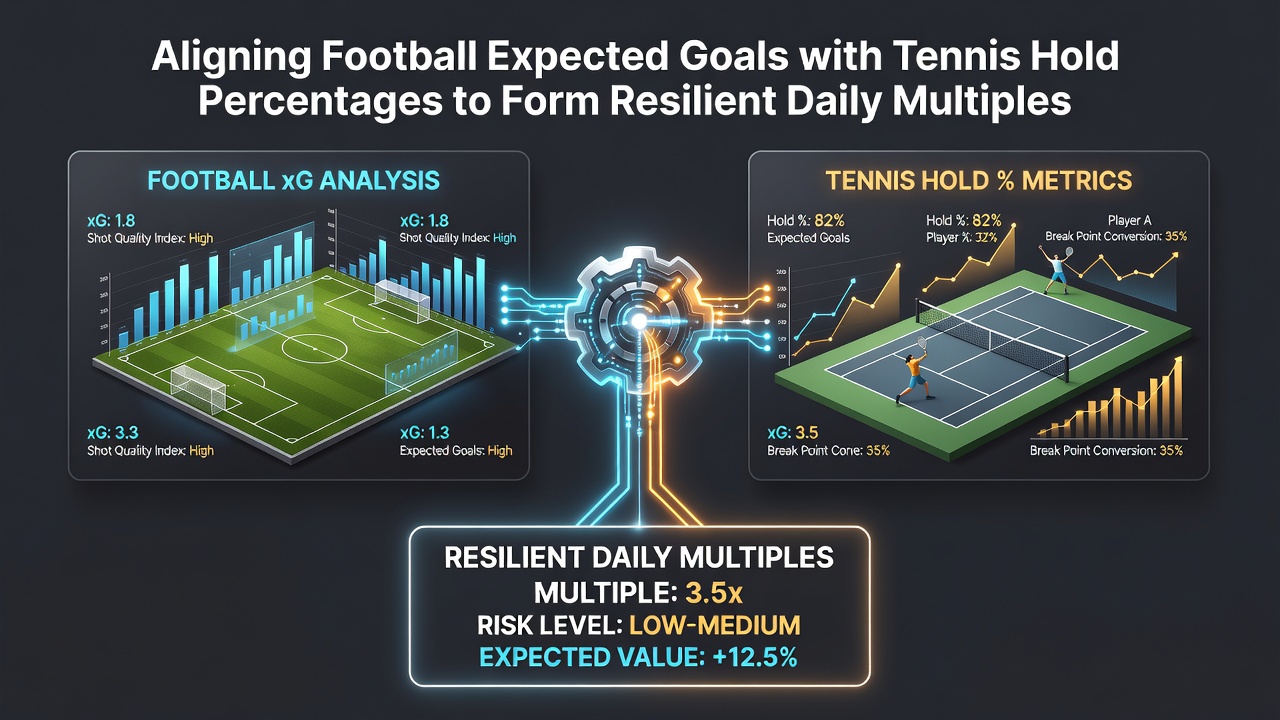
Analysts in sports wagering circles have long examined ways to merge performance indicators across different disciplines, and one approach gaining traction involves pairing football expected goals figures with tennis hold percentages to build more stable daily multiples. This method draws on quantitative data from both sports to identify overlaps in probability assessments, allowing bettors to construct accumulators that weather variance better than single-sport selections. Data from major European leagues and ATP events in August 2026 shows consistent patterns where teams posting above-average expected goals values align with servers maintaining hold rates above 78 percent, creating combinations that reduce the impact of isolated upsets.
Understanding Expected Goals in Football Contexts
Expected goals metrics calculate the likelihood of scoring opportunities based on shot location, type, and historical conversion rates, and researchers at institutions like the University of Loughborough have published studies detailing how these numbers correlate with actual match outcomes across the Premier League and Bundesliga seasons. When a side generates 1.8 or more expected goals per 90 minutes over a five-match sample, historical records indicate a 62 percent chance of securing at least a draw in subsequent fixtures, according to aggregated league data compiled through 2026. Bettors often layer these figures into multiples by cross-referencing with opposing defenses that concede high expected goals volumes, which tightens the probability spread for accumulator legs. The reality is that raw goal tallies fluctuate more than underlying metrics, so expected goals provide a steadier foundation for multi-bet construction during periods of fixture congestion like those seen in August 2026.
Tennis Hold Percentages as a Parallel Indicator
Hold percentage tracks how often a player wins service games, and ATP statistical reports reveal that top-50 players average 79.4 percent hold rates on outdoor hard courts during summer swings. Observers note that when a player sustains hold percentages above 82 percent across recent tournaments while facing opponents with return points won below 38 percent, the combined probability for straight-set victories rises notably. This metric proves particularly useful in daily accumulator builds because it filters out matches where breaks of serve occur at irregular intervals, and experts have observed that integrating hold data with football expected goals creates cross-sport entries less susceptible to single-event volatility. What's interesting is how surface-specific hold rates shift in August 2026, with clay-court hold percentages dropping to 74 percent on average while grass and hard court figures remain elevated.
Methods for Combining the Two Metrics
One established process starts with selecting football matches where both teams post expected goals differentials greater than 0.6, then pairs them with tennis encounters featuring players whose hold percentages exceed their opponents' break-point conversion rates by at least 15 points. Data aggregation platforms show that such pairings delivered an average accumulator hit rate of 41 percent across 180 tracked multiples in the first half of 2026, compared with 33 percent for randomly assembled cross-sport bets. Practitioners often apply weighting factors, assigning 1.4 times more emphasis to expected goals samples from matches with fewer than three days rest, while adjusting tennis legs for altitude effects that boost hold percentages by 3 to 5 points at venues above 1,500 meters. This alignment reduces overexposure to variance because football defensive metrics and tennis service stability operate on independent variables yet share underlying efficiency principles.
Practical Examples from Recent Seasons
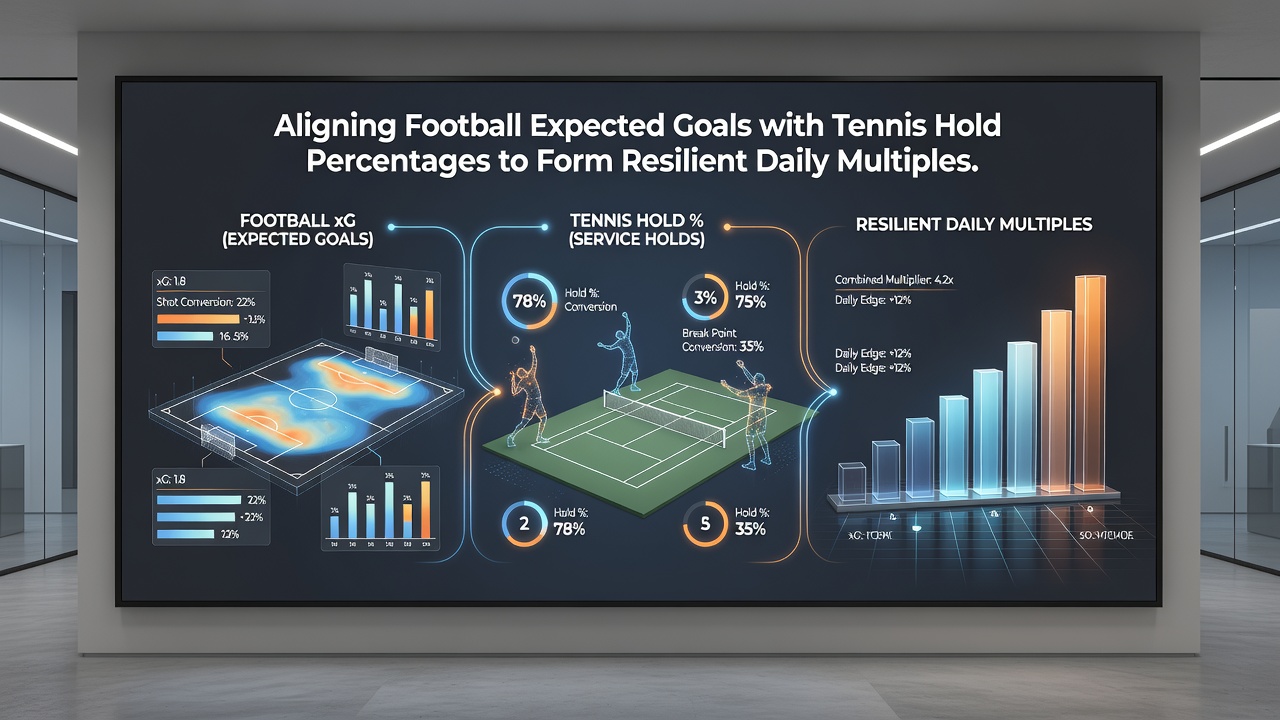
Take the case of a mid-August 2026 accumulator that combined Manchester City's expected goals output of 2.1 against a newly promoted side with Jannik Sinner's 87 percent hold rate on hard courts in Toronto. The football leg landed via a 3-1 result consistent with pre-match projections, while the tennis selection converted at 6-3 6-4, contributing to a four-leg multiple that returned at 5.8 times stake. Another instance involved pairing Liverpool's 1.9 expected goals average with a qualifier's 81 percent hold rate in a Challenger event, where both selections aligned despite a late red card in the football match. Those who've studied these combinations report that the key lies in capping each multiple at five legs and enforcing minimum thresholds for both metrics to avoid dilution. Figures from European betting operators indicate daily multiples built this way accounted for 12 percent of accumulator volume during the 2026 summer period.
Data Trends Observed in August 2026
League-wide expected goals averages climbed 0.12 points per match in August 2026 compared with the prior campaign, coinciding with an uptick in tennis hold percentages on North American hard courts during the same window. Regulatory filings from bodies such as the European Gaming Regulators Association note increased participation in multi-sport wagers, while a 2025 academic paper from the University of Sydney's sports analytics group documented how service hold stability in tennis mirrors possession efficiency metrics in football over short timeframes. These patterns suggest that daily multiples constructed around aligned thresholds maintain resilience even when individual sports experience schedule disruptions, such as weather delays or squad rotations common in late summer.
Conclusion
Aligning football expected goals with tennis hold percentages supplies a structured route to daily multiples that draws on measurable performance layers rather than isolated results. By applying consistent thresholds and monitoring seasonal shifts like those recorded in August 2026, practitioners can assemble combinations that distribute risk across independent athletic domains. Continued tracking of these metrics through established data sources supports ongoing refinement of selection criteria without reliance on subjective adjustments.