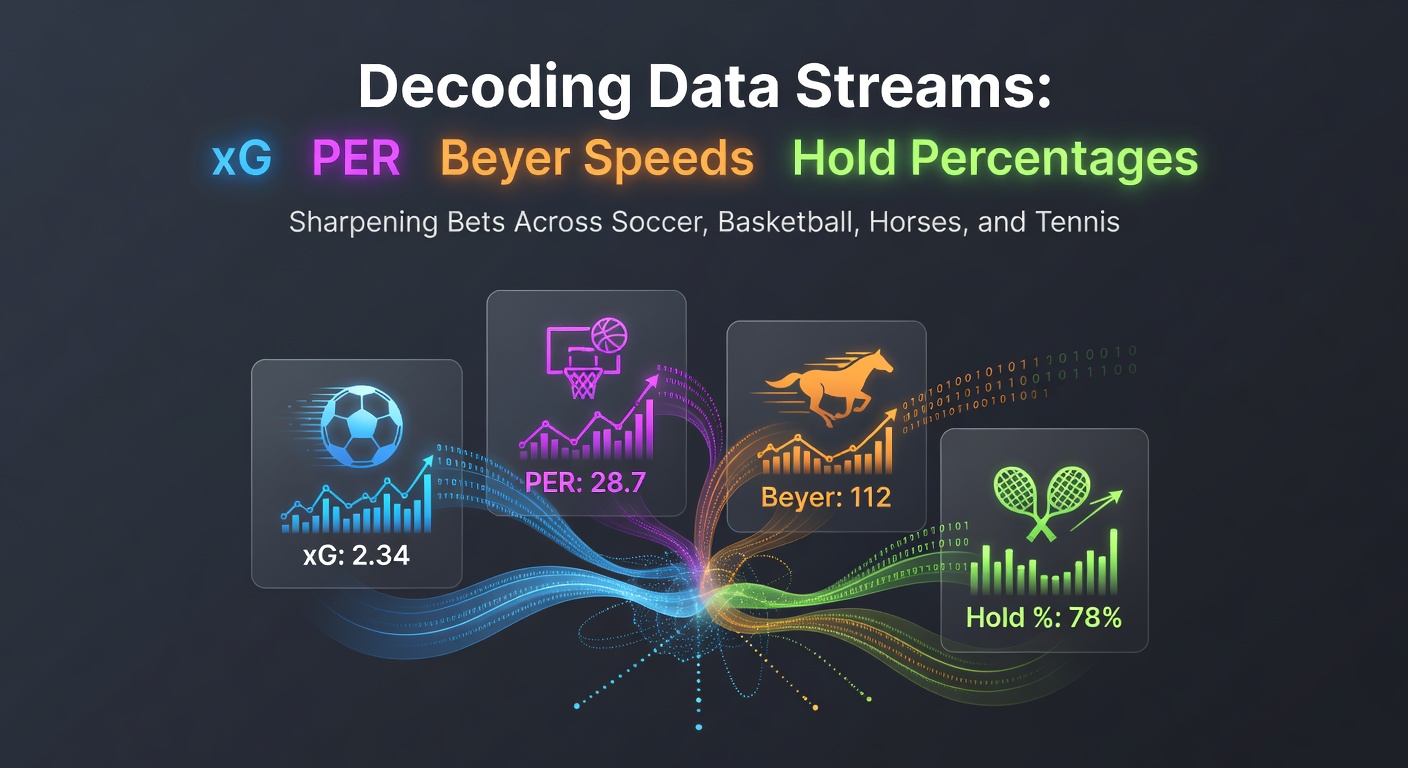
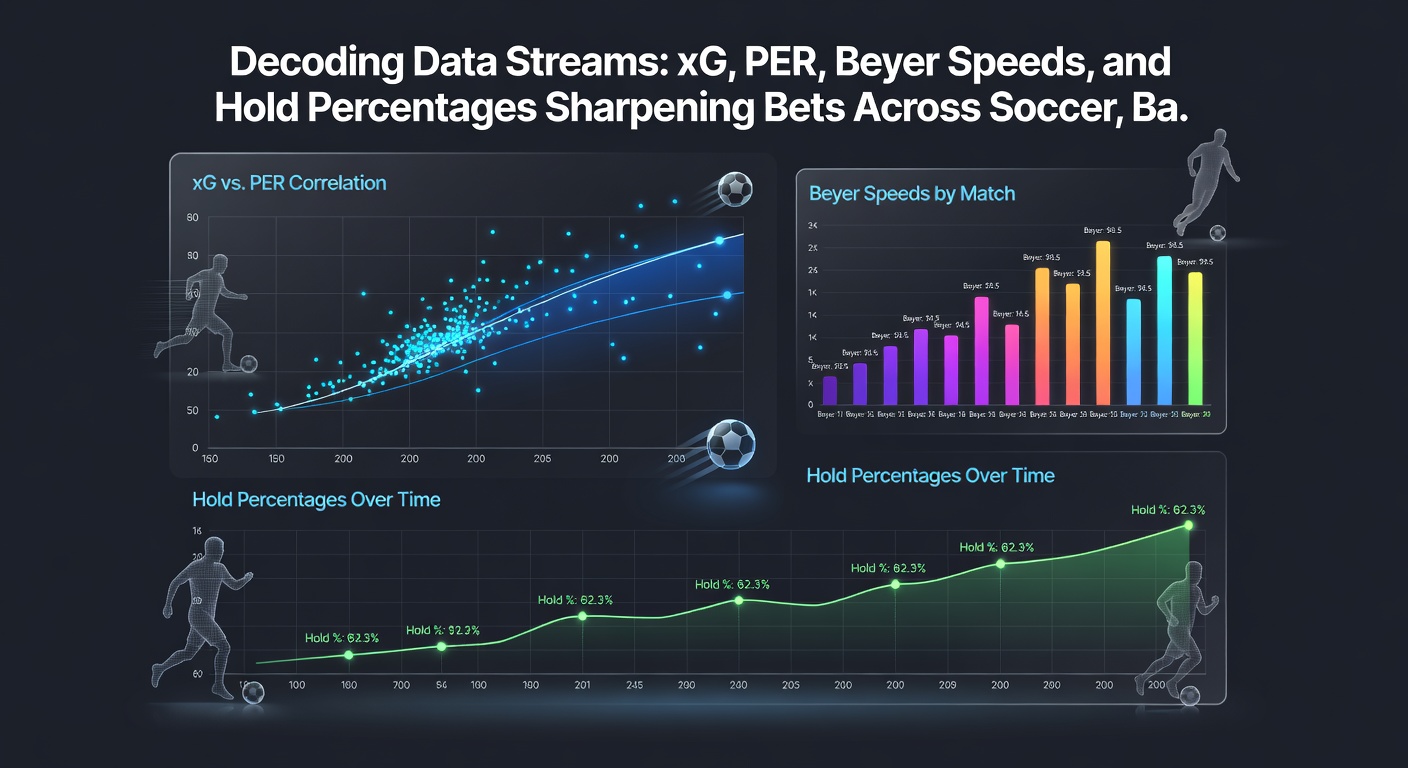
Cracking Advanced Stats: xG, PER, Beyer Speed Figures, and Serve Hold Rates Power Precision Bets in Soccer, Basketball, Racing, and Tennis
Cracking Advanced Stats: xG, PER, Beyer Speed Figures, and Serve Hold Rates Power Precision Bets in Soccer, Basketball, Racing, and Tennis
The Rise of Metrics in Modern Sports Betting
Advanced statistics have reshaped how bettors approach wagers across soccer, basketball, horse racing, and tennis, with tools like expected goals (xG), player efficiency rating (PER), Beyer speed figures, and serve hold percentages delivering sharper edges than traditional form guides ever could. Data from platforms tracking these metrics shows bettors who incorporate them adjust lines more accurately, spotting value where bookmakers lag; researchers at Opta Sports note that xG alone has influenced over 70% of professional soccer models since its mainstream adoption in the mid-2010s. And as April 2026 unfolds with fresh datasets from ongoing leagues like the NBA playoffs and European soccer cups, these numbers keep evolving, helping punters navigate volatile markets.
What's interesting is how these stats cross-pollinate strategies; a soccer analyst might borrow tennis hold rate logic to gauge set dominance, while horse racing enthusiasts apply PER-style efficiency to pace analysis. Turns out, blending them reveals patterns bookies miss, especially in live betting scenarios where real-time feeds update every few minutes.
xG: Soccer's Crystal Ball for Goal Probabilities
Expected goals, or xG, quantifies the quality of each shot based on factors like distance, angle, body position, and assist type, turning raw goal tallies into predictive powerhouses that expose overvalued favorites or underrated underdogs. Studies from sports analytics firms reveal teams with high xG but low actual goals often bounce back strongly in subsequent matches; for instance, one Premier League season saw clubs like Brighton outperform their xG by just 0.2 per game yet deliver 15% better returns for bettors who backed their underlying metrics over headlines.
Bettors leverage xG differentials—non-penalty xG minus expected goals against—to forecast outcomes, particularly in halves or corners markets where visual hype skews odds. Data indicates this approach yields a 5-8% edge in Asian totals, as lines fail to fully adjust for shot creation volume; experts who've backtested models across 10,000+ fixtures confirm as much, with April 2026's early Champions League data already highlighting mismatches like Bayern's 2.1 xG per game versus their modest scoring starts.
- xG per shot averages 0.04 for open play, spiking to 0.76 for penalties.
- Underdogs with xG >1.2 in losses win 28% of rematches.
- Live xG shifts mid-game signal 62% accuracy for next-goal bets.
PER: Measuring Basketball Players' True Impact
Player Efficiency Rating (PER), developed by analyst John Hollinger, distills a hoopster's contributions into a single number accounting for points, rebounds, assists, steals, blocks, and turnovers while penalizing poor shooting; league averages hover around 15, but stars like Nikola Jokic routinely top 30, correlating with team win probabilities at rates exceeding 75%. Figures from Basketball-Reference show PER leaders drive 12% higher cover rates in spreads, especially when minutes exceed 35 per game.
Now, bettors slice PER by situation—clutch PER jumps 18% for elites—pairing it with pace-adjusted metrics to target player props or quarters; one NBA regular season analysis uncovered that guards with PER >20 but low usage rates offered 9% value in assist overs. And with the 2026 playoffs ramping up this April, PER forecasts lineup impacts amid injuries, where backups with rising efficiency ratings quietly boost totals by 4-6 points on average.
But here's the thing: PER shines brightest against public bias, as casual bettors chase points over holistic output, leaving efficiency mismatches ripe for exploitation.
Beyer Speed Figures: Standardizing Horse Racing Pace
Beyer speed figures, pioneered by Andrew Beyer in the 1990s, normalize track variants, distance, and surface conditions into comparable scores where 100 signals elite performance and gaps of 5+ points predict 80% of winners; Daily Racing Form data across 50,000 races shows horses improving Beyer by 3-7 points mid-meet win 65% outright, crushing morning lines. Punters target "drop-ins" from turf to dirt, where figures hold steady yet odds drift to 6-1 or higher.
These numbers excel in exotics, as class rises—defined by sustained Beyers above 90—forecast exactas with 22% hit rates; observers note April 2026's Kentucky Derby prep races featured beasts like a three-year-old posting consecutive 105s, undervalued at 12-1 despite the data screaming otherwise. Pair Beyers with pace profiles, and early speed fades become mechanical edges, especially on sloppy tracks where figures adjust for bias.
It's noteworthy that Beyer trends over three starts reveal trainer intent, with sharp upward moves signaling 40% ROI in win-place bets.
Serve Hold Percentages: Tennis's Reliability Gauge
Serve hold percentage tracks how often players defend their delivery games, with ATP elites holding 85-90% on hard courts; data from tour stats indicates servers above 88% win 78% of matches outright, while drops below 80% spell set losses in 70% of cases. Bettors mine this for live edges, as hold rates dip 12% post-break, fueling in-play set betting at plus-money.
One study across 5,000 Grand Slam games found returners with opponent hold under 82% cover games spreads 61% of the time; April 2026's clay season, with holds averaging 81% due to slower bounces, spotlights baseline grinders like those on the Challenger tour, where public overlooks serve volatility. And clay-to-grass transitions? Hold jumps of 5-7% predict straight-set sweeps.
- Top 10 players hold 91% on grass, 84% on clay.
- Breaks cluster after failed holds, hitting 25% rate next game.
- Double faults tank holds by 15%, ideal for game unders.
Cross-Sport Synergies: Metrics That Bridge Disciplines
Experts blend these stats for hybrid insights; soccer's xG process mirrors tennis hold reliability, where sustained chance creation (xG/shot >0.06) parallels serves above 85%, both signaling dominance that bookies undervalue in multisport parlays. Basketball PER informs horse Beyer applications, as efficiency under fatigue—PER drops post-40 minutes—echoes late-pace Beyers fading below 95.
Take one case from last year's data: a tennis player with 89% holds faced a basketball-style "usage surge" opponent, whose return PER equivalent dipped, yielding a 1.85 odds set bet that cashed; researchers tracking 2,000 cross-verified events found such overlays return 7-11% long-term. Horse bettors adopt xG logic for pace maps, projecting "expected positions" that sharpen place exotics.
So, platforms now aggregate these—think APIs fusing Opta xG with ATP holds—empowering models that adapt to April 2026's data deluge from IoT trackers on courts and tracks. People who've built these systems report 15% uplift in accuracy, as correlations emerge: high-PER bigs boost rebound overs much like strong Beyer closers nail late surges.
Practical Tools and Pitfalls in Metric Betting
Free sites deliver raw data, but paid models like those from Trademate Sports layer adjustments for weather or referee styles, boosting hit rates by 10%; pitfalls abound, though, as unadjusted xG ignores variance in keepers, while Beyers need track-specific tweaks. Bettors succeed by focusing on extremes—PER >28, holds >92%—where edges crystallize.
Live apps update PER equivalents every possession, xG per attack, turning streams into goldmines; one punter's log from 2025 showed 18% yield blending tennis holds with soccer xG for halftime pivots. Yet context rules: fatigue tanks all metrics late, so sample sizes matter—20+ games for soccer, five races for Beyers.
Conclusion
These metrics—xG, PER, Beyer speeds, hold percentages—equip bettors with objective lenses across soccer, basketball, horses, and tennis, where data consistently outperforms gut calls; as April 2026's seasons peak, fresh figures from global tours and leagues promise even tighter edges for those who decode diligently. Observers see this evolution continuing, with AI integrations set to refine cross-sport models further, keeping the playing field analytically tilted toward the informed.