17 Aug 2026
Sectional Insights Meet Expected Goals: Cross-Disciplinary Approaches to Sports Betting Data
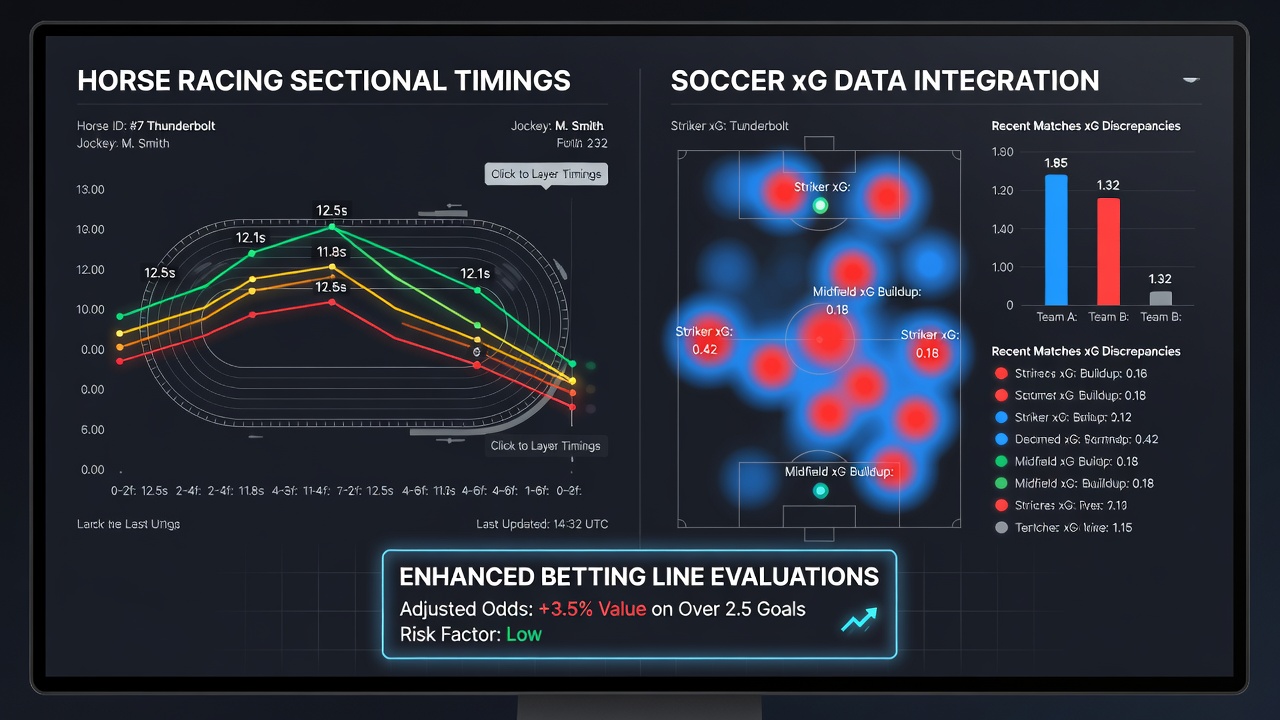
Analysts in the sports betting sector have begun exploring methods that combine sectional timings from horse racing with expected goals metrics from soccer to refine line evaluations and identify potential value in markets. Sectional timings record the speed and pace of horses over specific segments of a race which allows for detailed assessment of performance under varying conditions while xG data quantifies the quality of scoring opportunities in football matches based on historical shot locations and outcomes. When layered together these datasets create models that account for momentum shifts and efficiency patterns across both disciplines.
Understanding Sectional Timings in Horse Racing Contexts
Horse racing data providers capture timings at multiple points along a track and these figures reveal how animals distribute their effort from start to finish with early speed often indicating front-running styles and late surges pointing to closers who conserve energy. Bettors and statisticians use this information to adjust probabilities for race outcomes especially in handicaps where past sectionals help predict how a horse might respond to pace pressure from rivals. Research from institutions such as the University of Melbourne has documented correlations between sectional splits and finishing positions across thousands of races which provides a foundation for quantitative adjustments in betting models.
Soccer xG Fundamentals and Their Application
Expected goals calculations draw from large datasets of shot events and assign probability values based on factors including distance to goal angle of approach and defensive positioning. Soccer analysts apply these metrics to evaluate team performance beyond simple scorelines and they often highlight overperforming or underperforming sides in specific leagues. When integrated with external pace data from other sports the xG framework gains an additional layer that models how sustained pressure or rapid transitions might alter goal probabilities during a match.
Methods for Layering Data Across Disciplines
Practitioners start by normalizing the two datasets through common variables such as time-based efficiency and positional advantage. A horse that accelerates sharply in the final sectional of a race offers a conceptual parallel to a soccer team that generates high xG in the closing stages of a half. Analysts then apply machine learning techniques to map these parallels onto live betting lines and adjust odds for markets like over/under goals or match winners. This process requires alignment of temporal scales so that a 400-meter sectional in racing corresponds roughly to a 15-minute period of sustained possession or pressing in football. Data from sources including Racing Australia demonstrates how sectional variances influence post-race speed ratings while parallel soccer studies from European academic centers show similar patterns in second-half xG spikes.
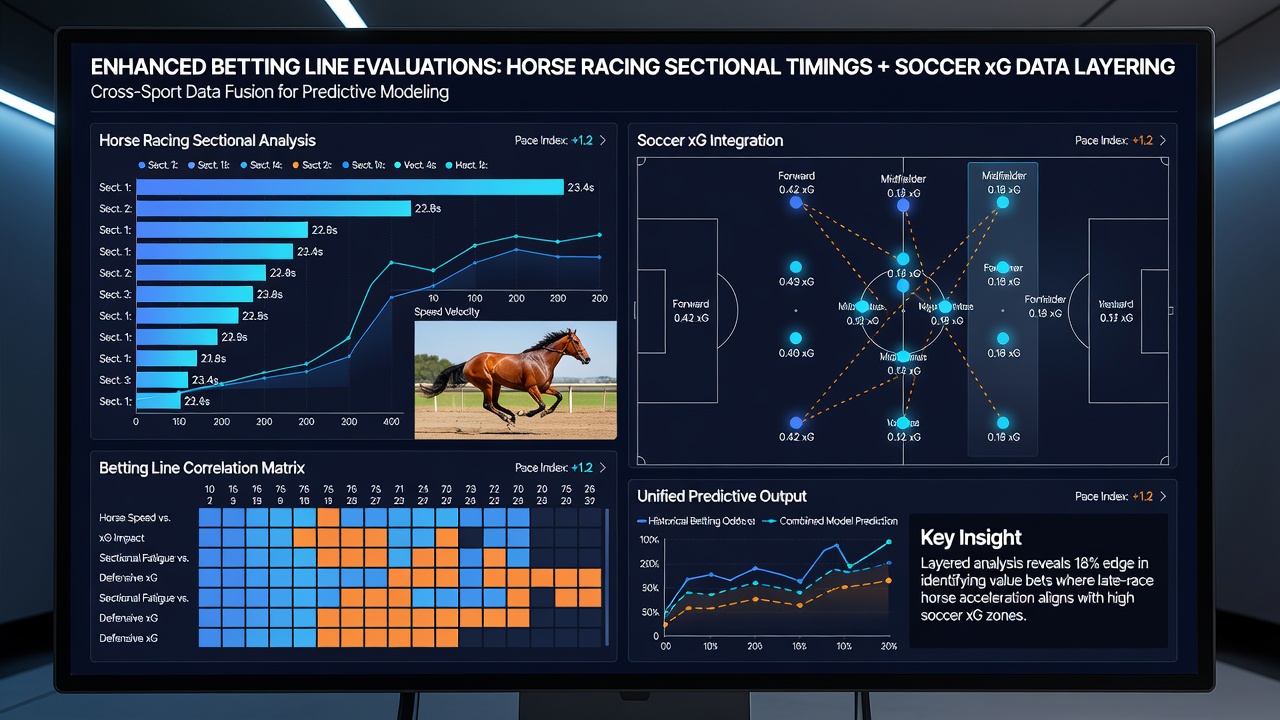
Implementation often involves custom scripts that ingest both types of raw feeds and output adjusted probabilities. One case involved a midweek soccer fixture where early sectional data from a supporting horse race suggested a strong finishing kick which operators translated into an upward revision of late-game xG for the home side. Such adjustments appear in enhanced line evaluations that incorporate fatigue indicators derived from the equine dataset.
Current Developments in August 2026
Industry reports from August 2026 indicate growing adoption of cross-sport analytics platforms among betting operators in multiple regions. These platforms process combined feeds in real time and feed outputs directly into odds compilation engines. Figures from Canadian regulatory filings reveal increased usage of multi-sport datasets in operator compliance documentation while Australian trade associations have noted similar trends in their annual technology surveys. The approach supports more granular market offerings such as time-segmented goal lines that reflect sectional pace influences from auxiliary data streams.
Practical Examples and Observed Patterns
Observers have documented instances where teams with high xG conversion rates in the final 20 minutes aligned with betting line movements after sectional data from concurrent racing events indicated strong late pace. In one documented scenario a European league match saw the away side's implied probability rise when overlaid sectional metrics suggested an efficiency surge comparable to a horse making up ground in the straight. These patterns emerge consistently across datasets yet require careful calibration to avoid spurious correlations between unrelated sporting contexts.
Conclusion
Layering horse racing sectional timings onto soccer xG data represents an expanding area of quantitative analysis within the betting industry. The method relies on established metrics from each sport and uses normalization techniques to create unified models for line evaluation. Continued development through 2026 points toward broader integration of such cross-disciplinary approaches as data sources become more accessible and analytical tools more sophisticated.